Return to index
MANDELBROT ANIMATIONS [200x300]
Click on the image name see the animation.
|
|
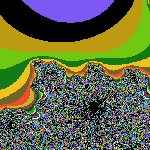
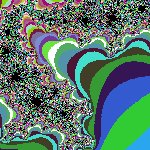
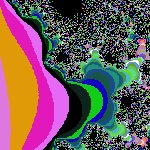
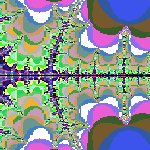
These pictures are visualisations of valleys, inlets, clouds, lakes
and precipices. The border points are incredibly hard to compute with
the iteration z<-z^2+c taken hundreds of times. Border points are
found by successive bisection of a line which has one end in the Mandelbrot
set and one point outside. Bisection occurs 52 times, because this is
bit-size of the mantissa of a double precision number. The viewport
decreases in size as a geometric series.
|
THE BUG
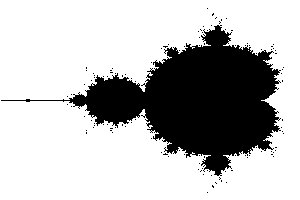
The Mandelbrot set is sometimes called the 'bug'. Computer rotating
algorithms show this. When the image is rotated the bug appears to
be sniffing or eating something. As it happens the proboscis is
longest when it points along a line with many rational numbers on it.
See www.linas.org
for a more detailed discussion
on the distribution of rationals on the unit interval / circle.
MANDELBROT ANIMATIONS 300 FRAMES
These .gif animations are made from 'affine' transformations of the
Mandelbrot Set. An affine transformation consists of a translation and
a rotation. Written in complex number notation this is essentially
T(z) = a + bz, where a and b are complex numbers. b itself can be
written as b = R (cos (t)+ i sin(t)) where t is a rotation. Each frame
of the animation uses the same displacement (a), while R falls off
as a geometric series R=k^n with |k|<1 while the phase angle t changes
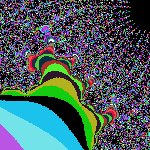
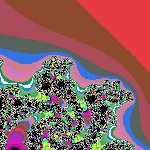
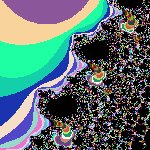
at a constant rate. The thumbnail images show a portion of the Mandelbrot
set and its boundary at 10^-14 of its original size.
| animation hit-03.gif |
| 0.34139189034144545865 |
| -0.07773598102348447392 |
 |
|
| animation hit-04.gif |
| -0.68577479306745614540 |
| 0.29412590059173676638 |
 |
|
| animation hit-07.gif |
| 0.28599128684118346744 |
| 0.48709694490443156134 |
 |
|
| animation hit-10.gif |
| -0.73819124056964557923 |
| -0.12772951611575639186 |
 |
|
| animation hit-12.gif |
| 0.15758720188099817339 |
| -0.57700049456699797901 |
 |
|
| animation hit-00.gif |
| -0.04741915099297703412 |
| 0.79993930710782068516 |
 |
|
| animation hit-01.gif |
| -0.65310273678648489426 |
| 0.34898009119894368713 |
 |
|
| animation x-axis.gif |
| -1.43 |
| 0.0 |
 |
|


